How to analyze an ETF: what's actually inside a fund
A fund's name doesn't tell you what you actually own. How to check its composition, concentration, and holding quality before you buy.
Research, not advice. This guide is educational. It explains a methodology and is not a recommendation to buy or sell any security. Full disclosure at the end.
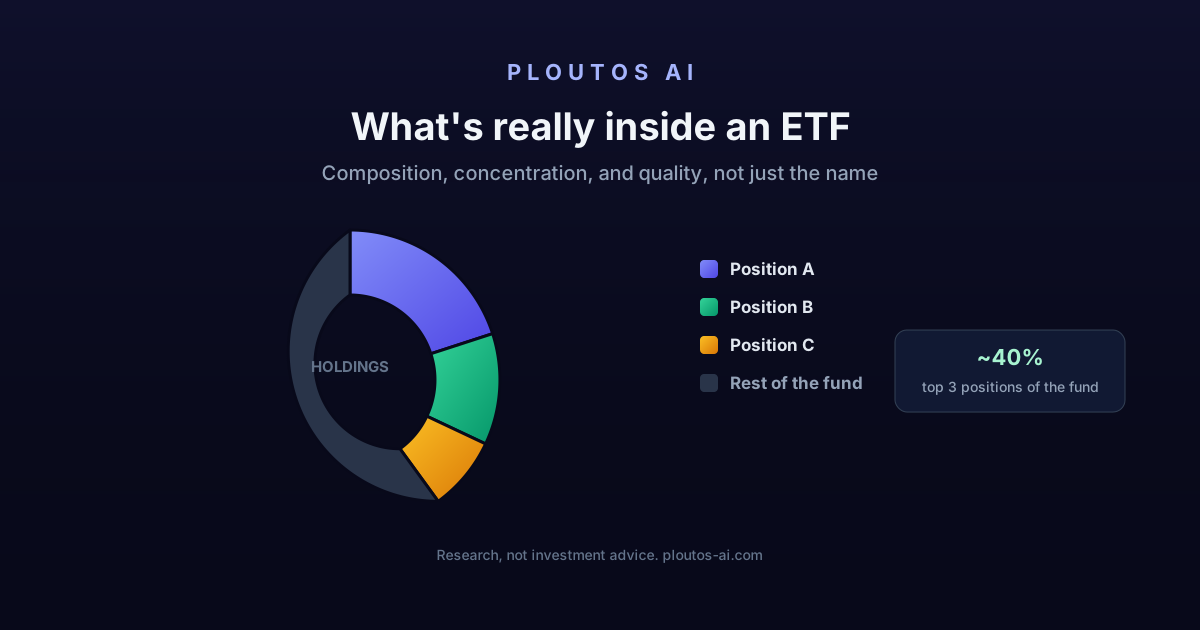
An ETF (Exchange-Traded Fund) isn't one investment, it's a basket of dozens to thousands of stocks or bonds, packaged under a single ticker you buy like a stock. Its name ("Technology," "Growth," "Dividend") gives you the general idea, but not what you actually own: how concentrated it is in a handful of positions, which sectors really dominate, or how high-quality the underlying companies are. This article shows you how to check that yourself, before you put money in.
In short:
- An ETF's name is marketing, not analysis: two funds with a similar title can have completely different compositions.
- The source of truth is the N-PORT filing every fund files monthly with the SEC, not the provider's fact sheet.
- Worth checking before the name or the past performance chart: concentration, sector tilt, expense ratio, and the average quality of the holdings.
- ETFs and individual stocks aren't rivals, they solve different problems.
Why a fund's name isn't enough
Two ETFs with nearly the same name can behave completely differently. A cap-weighted "technology" ETF might have a third of its portfolio in two or three mega-cap names, while another, equal-weighted, spreads the risk evenly across hundreds of names. A "dividend" ETF might emphasize high yield today, while another emphasizes decades of steady dividend growth, two very different risk profiles under a similar label.
That's not deception, it's just that an ETF's name is designed for marketing, not for due diligence. The only way to know what you're actually holding is to look at its composition directly.
What to check before you buy an ETF
Holdings composition. The full list of positions with their exact weights, not just the top-10 a fact sheet usually shows. A fund with 200 positions can have 60% of its value in the first 15.
Concentration. How much of the fund sits in its few largest positions. High concentration isn't automatically bad, but it means the ETF's return depends heavily on a handful of names, not the whole "basket" its name implies.
Sector and style tilt. Which sectors actually dominate, and whether the fund leans toward value, growth, or quality companies. A "broad market" ETF can today carry heavy exposure to one sector simply because that sector has grown disproportionately.
Expense ratio. The annual management cost, quietly deducted from the return every year. Over a decade or more, the gap between 0.05% and 0.75% annually compounds into a meaningful amount.
Quality of the underlying companies. Beyond what the ETF holds, there's how good those companies are fundamentally: profitability, debt, cash flow. An ETF is, in effect, the weighted average quality of its members, even though it's rarely presented that way.
Where to find the real numbers: the N-PORT filing
Every US-registered fund, ETFs included, is required to file a monthly N-PORT filing with the SEC: the full, detailed composition of its portfolio, public and free via SEC EDGAR. It's the official source, one step ahead of the provider's fact sheet or marketing page, which often shows rounded figures, stale data, or only the top 10 positions.
The gap matters most for lesser-known or more thematic ETFs, where the actual composition can diverge noticeably from what you'd assume just reading the name and the short description.
If you would rather not open the filing yourself, the same N-PORT data is laid out per fund on our holdings pages, for example SPY, QQQ and VTI: the reported positions, the sector split, what changed since the previous filing, and the funds most like it. The ETF overlap page puts two to five of them side by side.
A simple example
Take a hypothetical "Semiconductors" ETF. On paper, it looks like diversified exposure to an entire industry. In practice, because the semiconductor industry is dominated by a handful of very large companies, its N-PORT filing might show the top three positions covering 35-40% of the fund. You wouldn't see that from the name, only by looking at the actual composition. That's not necessarily a problem, it's just something worth knowing before you decide how it fits alongside the rest of your portfolio.
ETFs vs individual stocks: which do you pick?
They're not really rivals. For many investors, a broad ETF is a perfectly sensible choice: diversification with minimal effort, low cost, no need to track individual companies. Picking individual stocks is for people who want to do that deliberately, whether for part of their portfolio or out of genuine interest, and want to do it with discipline rather than tips or guesswork.
Even if you invest mainly through ETFs, it's worth knowing what you hold: an ETF is just a way of owning many companies at once, not something fundamentally different from them.
How Ploutos AI does it
Instead of showing you a rounded top-10 or leaving you to guess, Ploutos AI pulls an ETF's real composition directly from its most recent N-PORT filing with the SEC, then runs every holding through the same fundamental analysis it would apply if you'd typed it in individually: profitability, debt, cash flow, valuation. The result is a weighted score (how high-quality the average holding is, weighted by position size), a style profile (value, quality, growth), sector concentration, and expense ratio, all in one report.
If you want to see what that looks like on a real fund, run an analysis on any ETF, or check which ETFs stand out right now under the same methodology on Market Radar.
Frequently asked questions
How can I see what an ETF actually holds?
From the fund's most recent N-PORT filing with the SEC (EDGAR), which is public and free. It lists the full portfolio with exact weights, not the rounded top-10 you get from a fact sheet.
What is an N-PORT filing?
A monthly report every US-registered fund, ETFs included, is required to file with the SEC, disclosing the fund's full portfolio composition. It's the official source, one step ahead of the provider's marketing material.
What does "concentration" mean for an ETF?
How much of the fund sits in its few largest positions. Two ETFs with a similar theme can have very different concentration, one may effectively be a bet on 3-4 names, while another is genuinely spread out.
ETFs or individual stocks, which is better?
They're not competing. A broad ETF is a sensible choice for low-effort diversification. Picking individual stocks is for people who want to do that deliberately, with discipline, not tips.
How often does an ETF's composition change?
Depends on its strategy. A passive index fund changes rarely (mostly at index rebalancing). An actively managed or thematic ETF can turn over its holdings much more often.
Related reading
- ETF overlap: are your funds the same?Two popular UCITS ETFs share 455 of the same stocks. The measured overlap between an S&P 500 and an MSCI World fund, and how to check your own.
- What is a stock split?A stock split multiplies your share count and divides the price by the same amount. Here is what actually changes, what does not, and the one thing worth checking afterward.
- How to tell if a stock is overvaluedA high price doesn't make a stock overvalued. Learn the real signs: valuation multiples, the growth already priced in, and when a great company is still a bad price.
Important notice
This article is for general educational and informational purposes only. It is not investment advice and does not take into account your personal circumstances, objectives, or financial situation. Any security named is described for illustration and is not a recommendation to buy or sell.
Investing in stocks carries risk, including the possible loss of all invested capital. The past performance of any analysis, methodology, or strategy is not a reliable indicator of future results. Different investors reach different conclusions from the same information, depending on their objectives, time horizon, and risk tolerance.
You are solely responsible for your investment decisions. Before acting on any information from this site, you should assess whether it is appropriate for your circumstances and consult an appropriately qualified professional if you are in any doubt.
See the Terms for the full disclaimer and disclosures.
Try Ploutos AI on a ticker you're researching
Free tier includes 3 deep analyses per month. No credit card required.
Get started, it's free