ETF overlap: how much of your second fund did you already own?
Two popular UCITS ETFs share 455 of the same stocks. The measured overlap between an S&P 500 and an MSCI World fund, and how to check your own.
Research, not advice. This guide is educational. It explains a methodology and is not a recommendation to buy or sell any security. Full disclosure at the end.
You buy a global ETF for broad exposure. Later you add an S&P 500 ETF, because the US has been doing the heavy lifting and you want more of it. Two funds, two different names, two different indices. It feels like diversification.
Then you look inside them, and most of the second fund is the first one again.
How much do an S&P 500 fund and a global fund actually share?
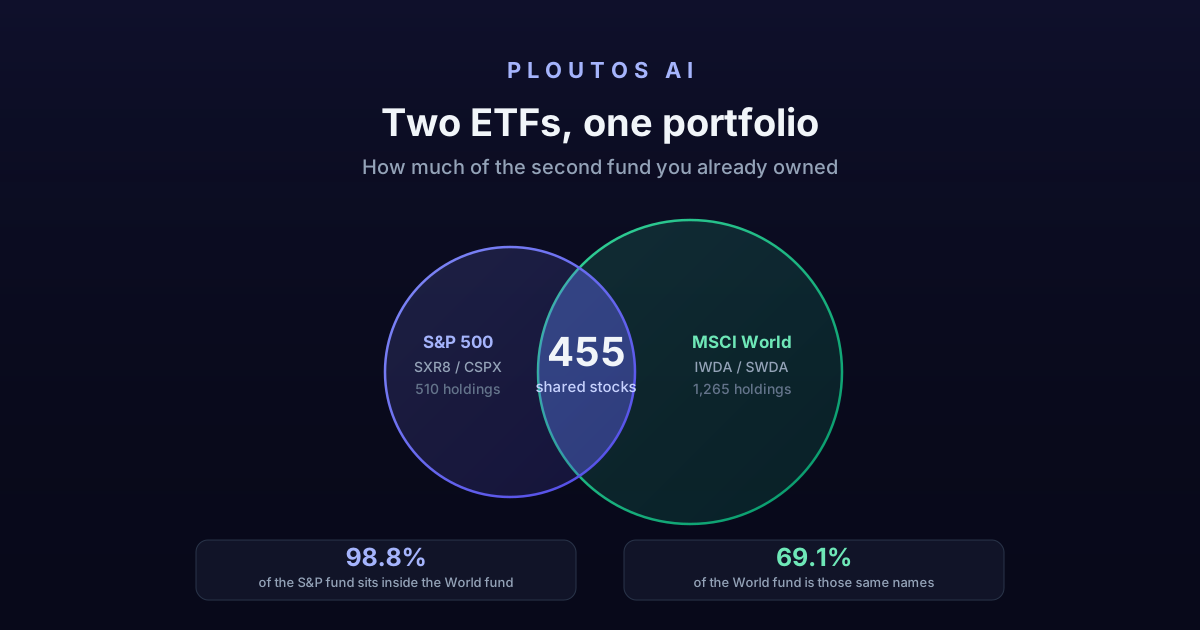
Here is the measurement, taken on 14 August 2026 from the issuer's own published holdings files.
| iShares Core S&P 500 | iShares Core MSCI World | |
|---|---|---|
| Tickers | SXR8, CSPX | IWDA, SWDA |
| Holdings with a listed ticker | 510 | 1,265 |
| Stocks held by both | 455 | 455 |
| Weight of those shared stocks | 98.8% | 69.1% |
The two funds hold 455 of the same companies. That is not the interesting part. The interesting part is the last row, where the same 455 stocks account for almost all of one fund and roughly two thirds of the other.
Why the overlap is asymmetric
An overlap figure is usually quoted as one number, and that hides what is actually going on.
The S&P 500 fund is nearly a subset of the global fund. Almost everything it owns, 98.8% by weight, is also sitting in the global fund. The global fund is the broader container: it holds those same US large caps and then roughly 800 more companies from Japan, the UK, Canada, and the rest of the developed world.
So the direction matters:
- If you already hold the global fund and add the S&P 500 fund, you are adding almost no new companies. You are increasing the weight of names you already owned.
- If you already hold the S&P 500 fund and add the global fund, you are genuinely adding something, because roughly 31% of the global fund by weight is companies the S&P fund does not hold at all.
Same pair of funds. Completely different answer depending on which one came first.
What this looks like at the individual stock level
The shared names are not a long tail of small positions. They are the largest positions in both funds, at different weights.
| Stock | In the World fund | In the S&P 500 fund |
|---|---|---|
| NVIDIA | 5.57% | 8.13% |
| Apple | 4.78% | 6.65% |
| Microsoft | 3.74% | 5.48% |
| Amazon | 2.79% | 3.92% |
| Alphabet (Class A) | 2.16% | 3.02% |
| Broadcom | 2.02% | 2.95% |
Every one of these appears in both funds. If you hold both, your actual position in each company is a blend of the two weights, and it is higher than either row suggests on its own. Nobody sets out to put a specific percentage of their savings into one chip designer. It arrives as a by-product of owning two funds that both track the same market from different angles.
This is the same concentration question the ETF composition guide covers for a single fund, except it compounds when funds are stacked.
How to check the overlap between your own funds
You do not need a tool or a subscription for this. The large issuers publish full daily holdings, free, on the product page for each fund.
- Find the fund's product page on the issuer's site. Search the ticker or the ISIN, not the marketing name, because near identical names exist across share classes.
- Download the holdings file. It lists every position with its ticker, ISIN, weight, sector and country.
- Do the same for the second fund.
- Match on ISIN rather than ticker. The same company can carry different ticker strings on different exchanges, and ISIN is unique. Ticker matching is quicker and usually close enough, but it will miss a few dual-listed names.
- Add up the weight of the matches, in each fund separately. Two numbers, not one. That asymmetry is the answer.
Two things worth knowing before you interpret what you get. Weights move with prices, so these figures drift week to week, and the ones in this article are a snapshot of one day rather than a constant. And the weights in a holdings file will not always sum to exactly 100%, because funds also hold cash and instruments that do not carry an equity ticker.
The same fund under two names
One more trap, and it is a cheaper mistake to avoid than the overlap itself.
SXR8 and CSPX in the table above are not two funds. They are the same iShares Core S&P 500 UCITS ETF, listed on different exchanges and quoted in different currencies. IWDA and SWDA are likewise one fund. A portfolio holding both SXR8 and CSPX has no diversification between them whatsoever, because there is nothing between them.
Before comparing two funds, check the ISIN of each. If the ISIN matches, the overlap is 100% and no further analysis is needed.
What the overlap number does and does not tell you
It tells you what you own. That is genuinely useful, and most people holding several funds have never added it up.
It does not tell you what to do about it. Whether a concentrated position is appropriate depends on why each fund is in the portfolio, and that is not something an article can determine from the outside. What the measurement does is replace an assumption with a figure, so any decision that follows is made against the real composition instead of against two fund names that sound different.
If you want the same treatment applied to individual companies, the fundamentals guide covers what to check inside a single business, and you can run an analysis on any of the names above to see what sits behind the weight.
The same measurement, run every week across the largest US equity ETFs, is published as a table on the ETF overlap page: which pairs share the most weight, and which stocks sit in the most funds. The US-listed counterparts of the two funds above have their own pages built from their SEC filings, IVV for the S&P 500 and URTH for MSCI World, and the pair itself is measured at IVV vs URTH.
For the US-listed side of the same question, we measured 35 of the most popular pairs in How different are the most popular ETFs?: SPY, VOO and IVV share 99.6% or more of their weight, while two dividend funds, SCHD and VYM, share 21.4%.
Frequently asked questions
What is ETF overlap?
The portion of two funds that is invested in the same companies. Two funds with different names and different indices can still hold most of the same stocks, so buying both adds less than the two names suggest.
How much do an S&P 500 ETF and an MSCI World ETF overlap?
Measured on 14 August 2026, the iShares Core S&P 500 (SXR8/CSPX) and the iShares Core MSCI World (IWDA/SWDA) held 455 of the same stocks. Those shared names were 98.8% of the S&P fund and 69.1% of the World fund.
Why is ETF overlap asymmetric?
Because one fund can sit almost entirely inside a broader one. An S&P 500 fund is nearly a subset of a global developed-market fund, so almost all of the first is contained in the second, while the second still holds many companies the first does not.
How can I check the overlap between my own ETFs?
Download each fund's daily holdings file from the issuer's product page, then compare them by ticker or ISIN and add up the weight of the names that appear in both. The large issuers publish this data free and update it daily.
Does overlap mean I should not own both funds?
That is not a question a page can answer for you, because it depends on what each fund is doing in your portfolio. What the numbers do tell you is how much genuinely new exposure the second fund adds, so you are deciding with the actual composition in front of you rather than the names.
Related reading
- How different are popular ETFs? 35 pairs measuredSPY, VOO and IVV share 99.6% or more. VTI is 88% S&P 500. Two dividend funds, SCHD and VYM, share only 21.4%. The overlap of 35 popular ETF pairs, from their SEC filings.
- How to read a 10-KWhat a 10-K is, where to find it, which parts to read first and what to look for in each. A guide to the annual filing US companies make with the SEC.
- Insider trades and Form 4: what they meanWhat Form 4 is, who counts as an insider, how to tell a real purchase from stock pay, and why an executive's sale usually says less than a purchase.
Important notice
This article is for general educational and informational purposes only. It is not investment advice and does not take into account your personal circumstances, objectives, or financial situation. Any security named is described for illustration and is not a recommendation to buy or sell.
Investing in stocks carries risk, including the possible loss of all invested capital. The past performance of any analysis, methodology, or strategy is not a reliable indicator of future results. Different investors reach different conclusions from the same information, depending on their objectives, time horizon, and risk tolerance.
You are solely responsible for your investment decisions. Before acting on any information from this site, you should assess whether it is appropriate for your circumstances and consult an appropriately qualified professional if you are in any doubt.
See the Terms for the full disclaimer and disclosures.
Try Ploutos AI on a ticker you're researching
Free tier includes 3 deep analyses per month. No credit card required.
Get started, it's free