The P/E ratio: what it really tells you, and when it misleads you
The price-to-earnings ratio explained simply: how it is calculated, what a P/E of 10 or 40 means, and five cases where a low P/E does not mean a cheap stock.
Research, not advice. This guide is educational. It explains a methodology and is not a recommendation to buy or sell any security. Full disclosure at the end.
If you have read even one stock analysis, you have seen the P/E ratio. It is the first number most people check to decide whether a stock is expensive or cheap, and for good reason: it is simple, it is everywhere, and it says something real.
It says less than we tend to think, though. A low P/E can be an opportunity, and it can just as easily be a warning. This article explains what the ratio measures, how to read it, and when it leads you to the wrong conclusion.
What the P/E ratio measures
P/E stands for price to earnings. The calculation is simple:
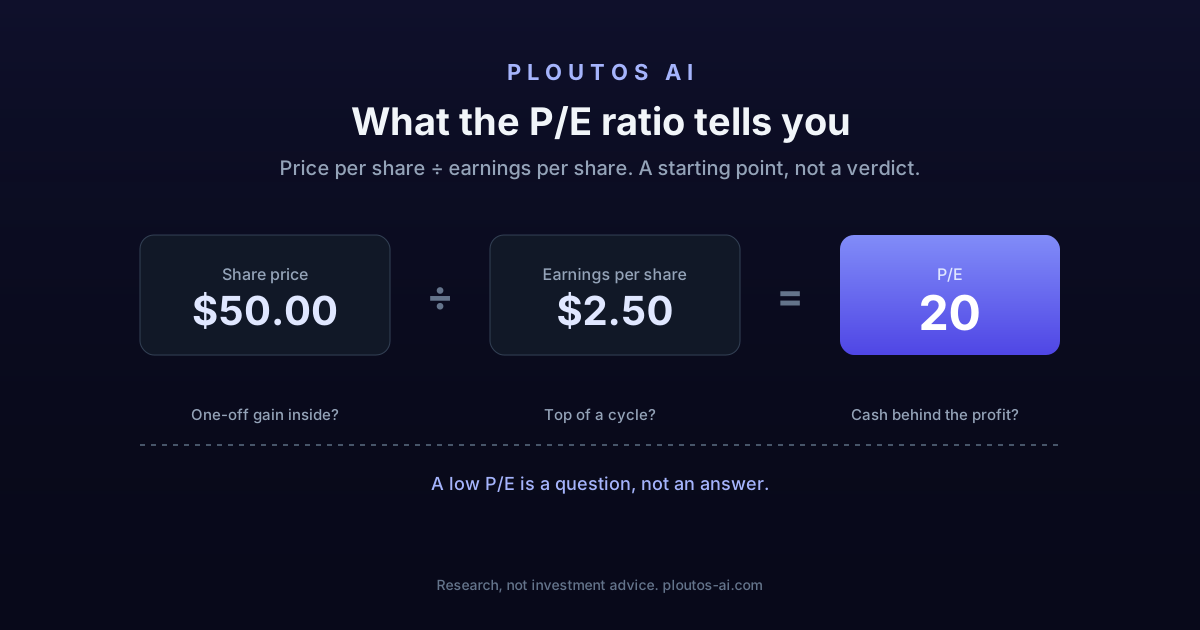
P/E = share price ÷ earnings per share (EPS)
Take a company whose stock costs 50 dollars and which earns 2.50 dollars of net profit per share a year. Its P/E is 20. In other words, you pay 20 dollars for every 1 dollar the company earns in a year.
Another way to see it: if earnings stayed flat forever and the company paid all of them out, it would take 20 years to get back what you paid. That is why a high P/E means the market expects earnings to grow, while a low one means it does not, or that it does not trust them.
The inverse of the P/E is the earnings yield. At a P/E of 20 the earnings yield is 5% (1 ÷ 20). It is a useful way to compare a stock with a bond or a deposit: what the company earns for every 100 dollars you put in.
Which earnings? Trailing and forward P/E
The same P/E can be calculated two ways, and the difference matters.
- Trailing P/E: uses the last 12 months of earnings, as reported in the company's filings. These are real numbers, but they look backwards.
- Forward P/E: uses the earnings analysts expect over the next 12 months. It looks ahead, but rests on estimates that often turn out optimistic.
Whenever you see a P/E, ask which earnings it uses. A forward P/E of 15 next to a trailing P/E of 30 means someone expects earnings to double within a year. That may happen. It may not.
A P/E only means something in comparison
There is no "right" P/E. A P/E of 12 can be expensive for a shrinking company, and a P/E of 35 reasonable for one growing quickly and steadily. Three comparisons make the ratio useful:
With the company's own history. If a company traded at a P/E around 18 for years and now sits at 11, something changed. Either the market is undervaluing it, or it knows something that changes the picture.
With companies in the same industry. Banks, energy companies and software companies have very different "normal" P/E levels, because they differ in growth, risk and quality of earnings. Comparing a bank with a software company on P/E tells you nothing.
With earnings growth. This is where the PEG ratio comes in: the P/E divided by the yearly earnings growth rate. A company with a P/E of 30 growing earnings 30% a year has a PEG of 1, the same as a company with a P/E of 10 growing 10%. The PEG has its own limits, because the growth you plug in is an estimate, but it forces you to ask the right question.
Five cases where the P/E misleads you
The ratio has two parts, and the problem nearly always hides in the earnings, not the price.
1. Earnings include something that will not happen again. A company that sold a factory or a division can report one year of very high earnings. The P/E drops sharply and the stock looks cheap. The next year earnings return to normal and the "cheap" disappears. It works the other way too: a large write-off can make a good company look very expensive for a year.
2. Cyclical companies at the top of the cycle. In industries like raw materials, shipping or construction, earnings rise and fall with the economy. At the top of the cycle earnings are huge and the P/E is low, exactly when earnings are most likely to fall. That is why in these industries a very low P/E often signals a hard stretch ahead, not a bargain.
3. Losses, or earnings close to zero. When earnings are negative, the P/E either comes out negative or is not calculated at all. When they are very close to zero it comes out enormous (100, 300, 1,000) and again means nothing. For such companies the P/E is simply the wrong tool. You look at sales, cash flow or the path to profitability instead.
4. Share buybacks. When a company buys back its own shares, there are fewer of them and earnings per share rise, even if total earnings stay the same. That is not bad in itself, but it means a rising EPS does not always mean a better business. It is worth checking total net income too, not only the per-share figure.
5. Accounting earnings that do not turn into cash. Earnings are an accounting number. A company can report profits while the cash coming in is much lower, for example because its customers are paying more and more slowly. That is why the P/E is best read next to cash flow, as the article on free cash flow explains.
A low P/E does not mean an undervalued stock
This is the most important point. A low P/E tells you the market pays little for today's earnings. It does not tell you why. Sometimes the market is wrong and the stock really is cheap. Often, though, the market is right: it expects earnings to fall, the company carries a lot of debt, or its business model is losing ground.
The difference between a cheap stock and one that only looks cheap is the subject of the article on undervalued stocks and value traps. The short version: to call something cheap you need an estimate of what it is worth, not just of what it costs relative to this year's earnings.
How to use the P/E
The P/E is a good place to start and a bad place to stop. A practical sequence of questions:
- Which earnings does it use? The last 12 months, or estimates?
- Are those earnings normal? Is there something one-off inside them? Is the company at the top or the bottom of a cycle?
- Low or high compared with what? Its own history? The industry? Earnings growth?
- Do the earnings turn into cash? Does cash flow agree with profit?
- What would have to happen for the market to be right? If the answer is likely, the low P/E is probably deserved.
That is why a serious valuation never rests on one ratio. The P/E is one of many numbers that feed a fair-value estimate, along with cash flow, debt and the quality of the business. How they combine is explained in the article on DCF valuation, and you can see them all together on a real company if you run an analysis.
Frequently asked questions
What is the P/E ratio?
The share price divided by earnings per share. A P/E of 20 means you pay 20 dollars for every 1 dollar of the company's yearly earnings.
What counts as a low P/E?
There is no single number for every company. A P/E only means something in comparison: with the company's own history, with companies in the same industry, and with how fast its earnings are growing.
Why can a low P/E be a trap?
Because the earnings underneath it may be inflated by something that will not repeat, may sit at the top of a cycle, or the market may have good reason to expect them to fall.
What happens to the P/E when a company loses money?
It stops meaning anything. With negative earnings the ratio comes out negative or enormous, and says nothing about valuation. Then you look at other measures, such as sales or cash flow.
Related reading
- How to read a 10-KWhat a 10-K is, where to find it, which parts to read first and what to look for in each. A guide to the annual filing US companies make with the SEC.
- Insider trades and Form 4: what they meanWhat Form 4 is, who counts as an insider, how to tell a real purchase from stock pay, and why an executive's sale usually says less than a purchase.
- ROIC and ROE: what they show and how they differReturn on invested capital (ROIC) and return on equity (ROE) explained simply: how they are calculated, why ROE is flattered by debt, and why ROIC says more about the quality of a business.
Important notice
This article is for general educational and informational purposes only. It is not investment advice and does not take into account your personal circumstances, objectives, or financial situation. Any security named is described for illustration and is not a recommendation to buy or sell.
Investing in stocks carries risk, including the possible loss of all invested capital. The past performance of any analysis, methodology, or strategy is not a reliable indicator of future results. Different investors reach different conclusions from the same information, depending on their objectives, time horizon, and risk tolerance.
You are solely responsible for your investment decisions. Before acting on any information from this site, you should assess whether it is appropriate for your circumstances and consult an appropriately qualified professional if you are in any doubt.
See the Terms for the full disclaimer and disclosures.
Try Ploutos AI on a ticker you're researching
Free tier includes 3 deep analyses per month. No credit card required.
Get started, it's free